
2014年考研英语二写作(大作文) · 题目、范文与解析
本页是 2014年考研英语二真题 写作 的写作真题页(图表 / 漫画大作文)—— 与试卷排版同一卷面:完整写作要求(Directions,词数要求 约 150 词) 与真题配图(附中文图意) 连续排印 ,卷面下方直接给出参考范文(143 词)与整篇中译、逐段拆解,另附审题立意、谋篇句架与评分自检 。
写作题和范文
本页写作题面、参考范文与逐段解析由懒笔记基于2014年 考研英语二写作原卷整理。与试卷排版同一卷面:完整写作要求(Directions,含主题、文体、词数与署名约束)、真题配图连续排印。写作是生产性任务、无 ABCD 标准答案——题面即整道题;卷面下方直接给出满足全部硬约束的参考范文、整篇中译与逐段拆解。
Write an essay based on the following chart. In your writing, you should
1)interpret the chart, and
2)give your comments.
You should write about 150 words on the ANSWER SHEET. (15 points)
【参考范文 · 143 词】写作无唯一标准答案,以下为达标示范
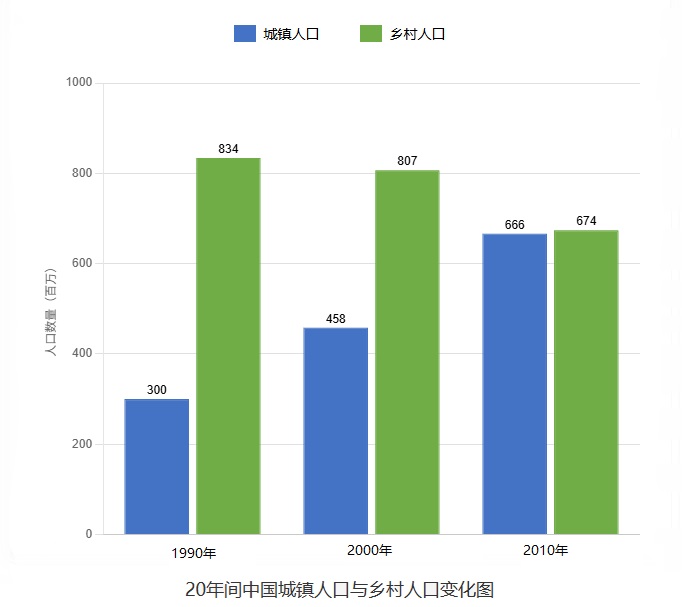
As is clearly illustrated in the column chart, remarkable changes took place in China's urban and rural populations over the two decades from 1990 to 2010. In 1990, the rural population stood at 834 million, far exceeding the urban figure of only 300 million. However, the situation reversed steadily: the urban population climbed to 458 million in 2000 and further to 666 million in 2010, while the rural population declined from 807 million to 674 million during the same period.
Several factors account for this striking trend. First, rapid industrialization and urbanization have created abundant job opportunities in cities, drawing large numbers of rural laborers. Second, better education and living conditions in urban areas also appeal to young people. In my view, this shift will continue, so the government should improve public services in cities and revitalize the countryside to achieve balanced development.
【参考译文】
如柱状图清晰所示,1990年至2010年这二十年间,中国的城镇人口与乡村人口发生了显著变化。1990年,乡村人口为8.34亿,远远超过城镇人口,后者仅为3亿。然而,这一局面稳步逆转:城镇人口在2000年攀升至4.58亿,2010年进一步升至6.66亿,而乡村人口同期则从8.07亿降至6.74亿。
造成这一显著趋势的原因有几点。首先,快速的工业化和城镇化在城市创造了大量就业机会,吸引了大批农村劳动力。其次,城市里更好的教育和生活条件也吸引着年轻人。在我看来,这一转变将持续下去,因此政府应改善城市的公共服务,同时振兴乡村,以实现均衡发展。
【第 1 段】描述段:套话开篇+升降对照。本段落实了'概括起止、点关键数':用 As is clearly illustrated in the column chart 引出图表,先以 the rural population stood at 834 million, far exceeding the urban figure of only 300 million 定基年对比,再用 while the rural population declined 把城镇升、乡村降对照写出,完成 interpret the chart,且只取起止关键数,未逐个罗列。
【第 2 段】评论段:归因+态度+建议。本段落实了'归因加建议':用 Several factors account for this striking trend 过渡,First / Second 给出工业化就业与城市吸引力两条紧扣人口流动的原因,再以 In my view 亮态度、以 the government should improve public services... to achieve balanced development 收束建议,完成 give your comments。
这道题到底要写什么、立意是什么
动笔前先钉死本题的核心写作任务与读者语域、读懂配图 ,再定中心立意与要展开的要点 —— 这些是本题特有的内容判断,不是通用套路。
先读图、再评论两件事
本题是双任务:既要 interpret the chart,又要 give your comments。'interpret'指用文字把图里的数据和趋势说清楚,'comment'指就这趋势谈看法(原因、意义或建议)。两件事缺一个都判为要点不全,所以审题时就要把它记成'描述+评论'两块,落笔时各占一段。
面向阅卷人的正式书面语
本题是议论性图表作文,没有具体收信人,读者就是阅卷老师。因此用正式的书面英语即可:不用称呼、不用署名,避免口语缩略和'you know'式表达,但要有清晰的连接词和完整句子。不必强行给它安排身份或情境,一句'面向阅卷人的书面语域'就够了。
城镇人口涨、乡村人口跌、末年反超
本图纵轴是以百万为单位的人口数,横轴是1990、2000、2010三个年份。带斜线填充(表示城镇人口)从 在1990年,带斜线填充的柱状的高度为300 一路升到2010年的666百万;实心(表示乡村人口)则从834百万降到674百万。最大看点是两者一升一降、到2010年城镇几乎追平乡村,主题正是 20年间中国城镇人口与乡村人口变化图,可写点就是这场此消彼长的城镇化。
城镇化推动人口此消彼长
全篇中心:过去二十年中国城镇人口持续上升、乡村人口持续下降,到2010年二者接近持平,这背后是城镇化进程的加速。描述段用数据坐实这个趋势,评论段解释它为何发生、并表明这一趋势将延续、需要引导。
- 描述:升降对比与反超 第一个要点是把 interpret the chart 落到位:概括城镇人口一路上升、乡村人口逐年下降,点出1990与2010的起止数值和二者末年几乎持平的反超趋势。
- 评论·原因:工业化与城市吸引力 第二个要点回答'为什么':快速的工业化、城镇化创造了大量就业岗位,加上城市里更好的教育和生活条件,吸引农村人口尤其是年轻人进城。
- 评论·态度:趋势延续与建议 第三个要点表明看法:这一 give your comments 的落点是判断趋势会继续,并给出建议——政府应完善城市公共服务、同时振兴乡村,实现城乡均衡发展。
怎么分段、每段写什么、能套哪些句架
按写作家族给出现成的段落框架(每段承担什么功能),并为每段配可直接套用的 功能句架(留出填本题内容的空位)。段序与上方参考范文一一对应。
- 第 1 段 描述段:概括趋势+关键数据 开篇引出图表,用一两句概括城镇人口上升、乡村人口下降的整体趋势,点出1990与2010的起止数值及末年反超,完成 interpret the chart。
- 第 2 段 评论段:原因+态度+建议 承接数据分析原因(工业化、城市吸引力),再表明个人看法并给出建议,完成 give your comments。
本段写:1990年乡村人口834百万远高于城镇的300百万;随后城镇人口升到2000年458、2010年666百万,乡村人口同期从807降到674百万,到2010年二者几乎持平。
- 开篇引出图表 As is clearly illustrated in the column chart, remarkable changes took place in ___ over ___.(横线填对象与时间跨度)
- 定基年作对比 In ___, ___ stood at ___ million, far exceeding ___ of only ___ million.(填年份与两组数值)
- 一升一降对照 ___ climbed to ___ million, while ___ declined from ___ to ___ million during the same period.(用 while 把升降对照)
本段写:快速工业化和城镇化创造大量城市岗位,吸引农村劳动力;城市更好的教育和生活条件也吸引年轻人。表明看法:这一趋势将延续,政府应完善城市公共服务并振兴乡村,实现城乡均衡发展。
- 承接转入归因 Several factors account for this striking trend. First, ___. Second, ___.(两条原因各填一句)
- 亮明个人态度 In my view, this shift will ___.(填对趋势走向的判断)
- 给出建议收尾 The government should ___ to achieve ___.(填具体措施与目标)
本题在四个评分维度怎样算达标、容易在哪丢分
按阅卷四维(内容切题 / 结构连贯 / 语言准确 / 字数格式)给出本题达标要点,并把最容易踩的低分写法摆出来 + 给改法 —— 这是写作版的「狠拆诱人错项」。
- 内容切题 描述与评论都要落到位 本题必须同时满足 interpret the chart 和 give your comments:既要有城镇升、乡村降的数据描述,也要有原因分析和看法,缺一个即要点不全。
- 结构连贯 两段分工要清晰 本题第一段只做描述、第二段只做评论,靠 However 完成升降转折、Several factors account for 完成描述到分析的过渡,不要把原因掺进描述段。
- 语言准确 过去年份用过去时 本题1990、2000、2010都是过去,range 描述用 stood at、climbed to、declined from...to;对比用 while/far exceeding,比反复用 is 更准更地道。
- 字数格式 达到要求篇幅、无需署名 本题 Directions 要求 about 150 words,写完核对是否落在合理区间;本题是议论文,不要加收信人称呼或落款。
- 六个数字逐个念 反面示例:In 1990, urban was 300. Rural was 834. In 2000, urban was 458. Rural was 807. In 2010, urban was 666. Rural was 674.(把六个数字排排坐,没有趋势和对比)。改:In 1990 the rural population reached 834 million, but it declined to 674 million by 2010, while the urban population rose sharply from 300 to 666 million.
- 编图外信息 反面示例:The chart shows that people moved abroad because of the war in 2010.(图里既无出国也无战争,纯属编造)。改:The chart reflects a massive rural-to-urban migration driven by industrialization, as cities offered more jobs.
- 写完趋势就收尾 反面示例:...and the two figures became almost equal in 2010. That is what the chart shows.(描述完戛然而止,没有任何评论)。改:...became almost equal in 2010. This striking shift results from rapid urbanization, and in my view the government should guide it toward balanced development.
- the number is more and more 反面示例:The urban people are more and more, and the rural people are less and less.(中式直译)。改:The urban population increased steadily, whereas the rural population dropped year by year.
常见问题
围绕本题的写作题目与要求、作文类型、配图说明、立意要点、参考范文、谋篇分段与评分丢分,逐条给出可核对的答案。
- 2014年考研英语二真题 写作的写作题目是什么?要求写多少字?
- 2014年考研英语二真题 写作(Section IV Part B)的写作要求为:Write an essay based on the following chart. In your writing, you should 1)interpret the chart, and 2)give your comments. You should write about 150 words on the ANSWER SHEET. (15 points) 本题要求约 150 词。
- 2014年考研英语二真题 写作属于哪种类型的作文、有什么格式要求?
- 2014年考研英语二真题 写作 是考研大作文(图表描述 / 漫画评论,先读图再评论)。写作要求约 150 词。题目配有一幅图表,动笔前需先读懂图表意再展开。
- 2014年考研英语二真题 写作的图表画的是什么、说明了什么?
- 2014年考研英语二真题 写作的图表内容为:这张图片是一张垂直柱状图,展示了1990年、2000年和2010年三个不同年份的两组数据。图表的纵轴是数量,以“百万”为单位,从0开始,以200为间隔,直到1000。横轴分为三个部分,分别标记为“1990年”、“2000年”和“2010年”。 每个年份都有两个柱状,一个带斜线填充(表示城镇人口),一个为实心(表示乡村人口)。每个柱状上方都标注了具体的数值: ● 在1990年,带斜线填充的柱状的高度为300,实心柱状的高度为834。 ● 在2000年,带斜线填充的柱状的高度为458,实心柱状的高度为807。 ● 在2010年,带斜线填充的柱状的高度为666,实心柱状的高度为674。 图表的底部居中位置有标题:“20年间中国城镇人口与乡村人口变化图”。 就本题而言,本图纵轴是以百万为单位的人口数,横轴是1990、2000、2010三个年份。带斜线填充(表示城镇人口)从 在1990年,带斜线填充的柱状的高度为300 一路升到2010年的666百万;实心(表示乡村人口)则从834百万降到674百万。最大看点是两者一升一降、到2010年城镇几乎追平乡村,主题正是 20年间中国城镇人口与乡村人口变化图,可写点就是这场此消彼长的城镇化。
- 2014年考研英语二真题 写作(先读图、再评论两件事)应该怎么立意、写哪几个要点?
- 2014年考研英语二真题 写作的中心立意是全篇中心:过去二十年中国城镇人口持续上升、乡村人口持续下降,到2010年二者接近持平,这背后是城镇化进程的加速。描述段用数据坐实这个趋势,评论段解释它为何发生、并表明这一趋势将延续、需要引导。可展开的要点:第一个要点是把 interpret the chart 落到位:概括城镇人口一路上升、乡村人口逐年下降,点出1990与2010的起止数值和二者末年几乎持平的反超趋势;第二个要点回答'为什么':快速的工业化、城镇化创造了大量就业岗位,加上城市里更好的教育和生活条件,吸引农村人口尤其是年轻人进城;第三个要点表明看法:这一 give your comments 的落点是判断趋势会继续,并给出建议——政府应完善城市公共服务、同时振兴乡村,实现城乡均衡发展。
- 2014年考研英语二真题 写作(先读图、再评论两件事)的参考范文是怎样的?多少词?
- 2014年考研英语二真题 写作的参考范文(143 词):As is clearly illustrated in the column chart, remarkable changes took place in China's urban and rural populations over the two decades from 1990 to 2010. In 1990, the rural population stood at 834 million, far exceeding the urban figure of only 300 million. However, the situation reversed steadily: the urban population climbed to 458 million in 2000 and further to 666 million in 2010, while the rural population declined from 807 million to 674 million during the same period. Several factors account for this striking trend. First, rapid industrialization and urbanization have created abundant job opportunities in cities, drawing large numbers of rural laborers. Second, better education and living conditions in urban areas also appeal to young people. In my view, this shift will continue, so the government should improve public services in cities and revitalize the countryside to achieve balanced development.
- 2014年考研英语二真题 写作(先读图、再评论两件事)这篇作文怎么分段、每段写什么?
- 2014年考研英语二真题 写作的参考范文共 2 段:第 1 段(描述段:概括趋势+关键数据)开篇引出图表,用一两句概括城镇人口上升、乡村人口下降的整体趋势,点出1990与2010的起止数值及末年反超,完成 interpret the chart;第 2 段(评论段:原因+态度+建议)承接数据分析原因(工业化、城市吸引力),再表明个人看法并给出建议,完成 give your comments。
- 2014年考研英语二真题 写作(先读图、再评论两件事)作文容易在哪丢分?
- 按内容切题 / 结构连贯 / 语言准确 / 字数格式四维评分,本题达标要点:内容切题——本题必须同时满足 interpret the chart 和 give your comments:既要有城镇升、乡村降的数据描述,也要有原因分析和看法,缺一个即要点不全;结构连贯——本题第一段只做描述、第二段只做评论,靠 However 完成升降转折、Several factors account for 完成描述到分析的过渡,不要把原因掺进描述段;语言准确——本题1990、2000、2010都是过去,range 描述用 stood at、climbed to、declined from...to;对比用 while/far exceeding,比反复用 is 更准更地道;字数格式——本题 Directions 要求 about 150 words,写完核对是否落在合理区间;本题是议论文,不要加收信人称呼或落款。 典型低分写法(须避免):反面示例:In 1990, urban was 300. Rural was 834. In 2000, urban was 458. Rural was 807. In 2010, urban was 666. Rural was 674.(把六个数字排排坐,没有趋势和对比)。改:In 1990 the rural population reached 834 million, but it declined to 674 million by 2010, while the urban population rose sharply from 300 to 666 million;反面示例:The chart shows that people moved abroad because of the war in 2010.(图里既无出国也无战争,纯属编造)。改:The chart reflects a massive rural-to-urban migration driven by industrialization, as cities offered more jobs;反面示例:...and the two figures became almost equal in 2010. That is what the chart shows.(描述完戛然而止,没有任何评论)。改:...became almost equal in 2010. This striking shift results from rapid urbanization, and in my view the government should guide it toward balanced development;反面示例:The urban people are more and more, and the rural people are less and less.(中式直译)。改:The urban population increased steadily, whereas the rural population dropped year by year。