
2021年6月·第2套英语六级写作(大作文) · 题目、范文与解析
本页是 2021年6月英语六级真题第2套 写作 的写作真题页(图表 / 漫画大作文)—— 与试卷排版同一卷面:完整写作要求(Directions,词数要求 150–200 词) 与真题配图(附中文图意) 连续排印 ,卷面下方直接给出参考范文(174 词)与整篇中译、逐段拆解,另附审题立意、谋篇句架与评分自检 。
写作题和范文
本页写作题面、参考范文与逐段解析由懒笔记基于2021年6月·第2套 英语六级写作原卷整理。与试卷排版同一卷面:完整写作要求(Directions,含主题、文体、词数与署名约束)、真题配图连续排印。写作是生产性任务、无 ABCD 标准答案——题面即整道题;卷面下方直接给出满足全部硬约束的参考范文、整篇中译与逐段拆解。
【参考范文 · 174 词】写作无唯一标准答案,以下为达标示范
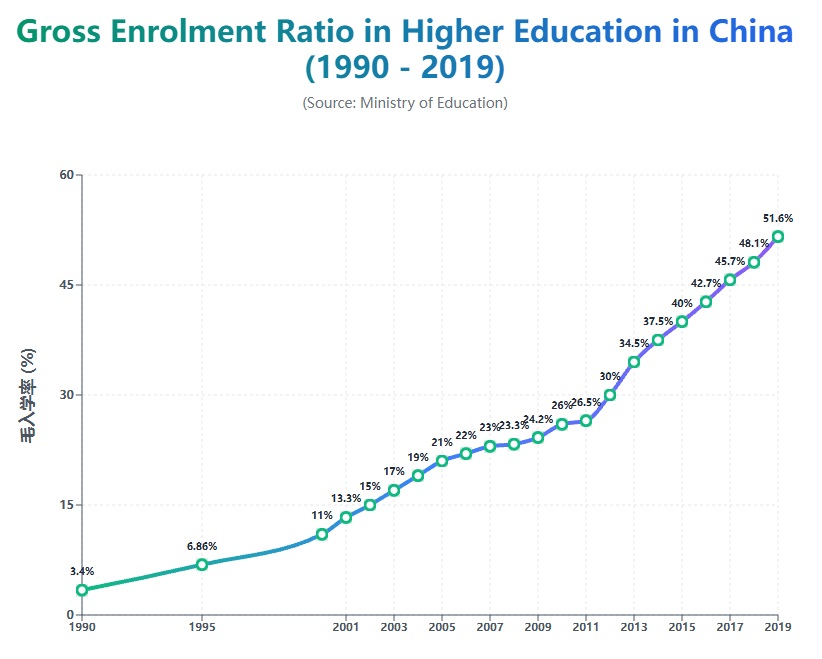
The line chart illustrates the changes in the gross enrolment ratio in higher education in China from 1990 to 2019. As is clearly shown, the figure witnessed a steady and remarkable upward trend over these three decades. In 1990, only 3.4% of the eligible population entered higher education. This proportion climbed steadily, passing 11% in 2000 and 30% in 2012, before finally reaching 51.6% in 2019, roughly fifteen times the initial level.
Behind these figures lie China's impressive achievements in higher education. First, the dramatic rise reflects the massive expansion of university enrolment, which has opened the door of college to millions of ordinary families. Moreover, the higher enrolment ratio means a far larger pool of skilled talent, supplying the economy with engineers, doctors and researchers. In my view, such progress not only improves individual prospects but also strengthens the nation's competitiveness.
In conclusion, the steady climb of the enrolment ratio speaks volumes about how far Chinese higher education has advanced, and I firmly believe this positive momentum will continue in the years ahead.
【参考译文】
这张折线图展示了1990年至2019年中国高等教育毛入学率的变化。如图所清晰显示的,在这三十年间该数字呈现出稳步而显著的上升趋势。1990年,只有3.4%的适龄人口进入高等教育。这一比例稳步攀升,2000年越过11%,2012年达到30%,最终在2019年升至51.6%,约为最初水平的十五倍。
这些数字背后是中国在高等教育方面令人瞩目的成就。首先,这一急剧上升反映了高校招生规模的大幅扩张,让千百万普通家庭的孩子得以迈进大学校门。此外,更高的入学率意味着更为庞大的技能人才库,为经济输送工程师、医生和研究人员。在我看来,这样的进步不仅改善了个人前景,也增强了国家的竞争力。
总而言之,入学率的稳步攀升有力地说明了中国高等教育已经走得多远,我坚信这一积极势头将在未来持续下去。
【第 1 段】总趋势领起再上数据。首句 The line chart illustrates the changes... 套用了"亮出图表主题"句架,完成"简要描述"的第一步;As is clearly shown... a steady and remarkable upward trend 先给整体结论,再用 3.4%、11% in 2000、30% in 2012、51.6% 挑点佐证,最后一句 roughly fifteen times 点出翻倍幅度——描述客观、不逐年罗列,落实了 outline 第一段"简要描述图表趋势"。
【第 2 段】概括句过渡后分点评论。Behind these figures lie China's impressive achievements 用一句概括句把话题从数字接到成就,承上启下;First... reflects the massive expansion of university enrolment 与 Moreover... a far larger pool of skilled talent 分两点写扩招与人才,每点都拴回图表数据;In my view... not only... but also 谨慎表态,兑现 outline 第二段的评论任务。
【第 3 段】重申核心并展望收尾。In conclusion, the steady climb... speaks volumes about how far Chinese higher education has advanced 换一种说法重申"上升=成就"这一核心,呼应主题;and I firmly believe this positive momentum will continue 以展望收束,不引入新论点,对应 outline 第三段"收束呼应主题"。
这道题到底要写什么、立意是什么
动笔前先钉死本题的核心写作任务与读者语域、读懂配图 ,再定中心立意与要展开的要点 —— 这些是本题特有的内容判断,不是通用套路。
先描述图表,再评价高教成就
这句 Directions 里藏着两个必做动作:先 start your essay with a brief description of the chart(客观描述图表走向),再 comment on 中国的 achievements in higher education(评价高教成就)。两件事缺一不可——只描述不评论、或只评论不描述,都会直接漏掉指令要求的任务点、内容分大打折扣。
面向阅卷人的正式书面语
本题是图表作文,没有具体收信人—— write an essay 面向的其实是阅卷老师,因此全程用正式书面语:以第三人称客观陈述数据,评论段可用 In my view 谨慎带出个人看法,但不要用 gonna、kids 之类口语缩写或俚语,也别写成聊天口吻。
折线图:毛入学率三十年一路飙升
配图是一张折线图 Gross enrolment ratio in higher education in China (1990 - 2019),横轴是年份、纵轴是毛入学率。最该抓的是整体飙升的大趋势:从 1990年: 3.4% 一路爬到 2019年: 51.6%,中间可挑 2000年: 11%、2012年: 30% 这两个节点当证据,而不是把每一年的数字都罗列出来。
毛入学率飙升印证高教巨大成就
中心一句话:中国高等教育毛入学率近三十年持续飙升,这组数字正是 achievements in higher education 的缩影。全篇既要描述这条上升曲线,也要把它读成成就的证据。
- 描述点:整体上升大趋势 客观转述数据走向:从 1990年: 3.4% 到 2019年: 51.6% 一路攀升,翻了约十五倍,挑两三个节点佐证即可,不逐年罗列。
- 评论一:扩招惠及普通家庭 入学率飙升背后是高校大规模扩招,让普通家庭的孩子也能迈进大学校门——这是 comment on 部分最实在的一个成就。
- 评论二:人才储备与国家竞争力 入学率提升意味着更庞大的技能人才库,为经济输送工程师、医生、研究者,从而增强国家竞争力,紧扣 achievements in higher education。
怎么分段、每段写什么、能套哪些句架
按写作家族给出现成的段落框架(每段承担什么功能),并为每段配可直接套用的 功能句架(留出填本题内容的空位)。段序与上方参考范文一一对应。
- 第 1 段 简要描述图表趋势 落实 start your essay with a brief description of the chart:一两句先点明图表主题与整体上升趋势,再用起点、终点和一两个节点数据佐证。
- 第 2 段 评论高教成就 用一句概括句过渡到 comment on 部分,从扩招惠及大众、壮大人才库两方面分析 achievements in higher education。
- 第 3 段 收束呼应主题 重申上升趋势的意义、表达展望,收尾并把全文控制在 at least 150 words but no more than 200 words 的区间内。
本段落到:图表主题是 Gross enrolment ratio in higher education in China (1990 - 2019);整体呈持续上升;用 1990年: 3.4%、2000年: 11%、2012年: 30% 和 2019年: 51.6% 这几个点勾出上升曲线,点明约翻了十五倍。
- 亮出图表主题 The line chart illustrates the changes in ___ from ___ to ___.(填指标与起止年份)
- 概括整体趋势 As is clearly shown, the figure witnessed a steady and remarkable ___ trend over ___.(填 upward/downward 与时间跨度)
- 挑点数据佐证 The figure climbed from ___ in ___ to ___ in ___, roughly ___ times the initial level.(填起止数据与倍数)
本段落到两条成就:一是入学率飙升源于高校大规模扩招,让普通家庭子女也能上大学;二是更高的入学率带来更庞大的技能人才库,为经济输送各类专业人才,从而 comment on 出这组数字背后的 achievements in higher education,并谨慎点出对国家竞争力的意义。
- 承上启下亮总评 Behind these figures lie ___.(填对图表整体意义的一句概括评价)
- 分点给原因/影响 First, the dramatic rise reflects ___, which has ___.(填成因,再接它带来的好处)
- 谨慎表态 In my view, such progress not only ___ but also ___.(填对个人与对国家两个层面的意义)
本段落到:上升曲线雄辩地说明中国高教已走得很远,呼应 achievements in higher education 的主题,并表达对这一势头持续向好的信心,收束全文。
- 重申+收束 In conclusion, ___ speaks volumes about ___, and I firmly believe ___.(填核心趋势、它说明的成就、以及展望)
本题在四个评分维度怎样算达标、容易在哪丢分
按阅卷四维(内容切题 / 结构连贯 / 语言准确 / 字数格式)给出本题达标要点,并把最容易踩的低分写法摆出来 + 给改法 —— 这是写作版的「狠拆诱人错项」。
- 内容切题 描述与评论两个任务都要有 本题两个采分动作缺一不可: start your essay with a brief description of the chart 与 comment on 中国的 achievements in higher education。最易失分处就是只写了其中一个。
- 结构连贯 用概括句从描述过渡到评论 本题最考验衔接的地方是从数据描述转到评论,务必用一句概括句(如 Behind these figures lie...)承上启下,别让"评论"突兀地砸出来。
- 语言准确 描述数据的动词与介词要准 本题密集出现趋势描述,rise to / climb from...to / reach + 数字这类搭配要用准;避免 the number rise(主谓不一致)、up to 与 reach 混用这类硬伤。
- 字数格式 卡进150到200词的硬区间 本题硬性要求 at least 150 words but no more than 200 words,写太短或超过上限都会扣分;用节点数据而非逐年罗列,正好帮你把篇幅控制在区间内。
- 只描述数据不评论 反面示例:全篇只写 The ratio was 3.4% in 1990, 11% in 2000, 30% in 2012, and 51.6% in 2019.(从头念到尾,只有数字没有一句评价)。修正:在描述之后另起一段评论,如 These rising figures reflect the remarkable achievements China has made in higher education, especially the expansion of university enrolment.
- 逐年罗列数据 反面示例:In 1990 it was 3.4%, in 1995 it was 6.86%, in 2000 it was 11%, in 2001 it was 13.3%...(把二十多个数据全念一遍)。修正:The figure climbed steadily from 3.4% in 1990 to 51.6% in 2019, roughly fifteen times the initial level.
- 空泛喊口号不结合图 反面示例:Education is very important. Our country is becoming stronger and better every day.(正确的废话,与图表毫无关联)。修正:The jump from 3.4% to 51.6% shows how greatly higher education has expanded, giving far more young people access to college.
- 中式英语硬译趋势 反面示例:The number rise very high and go up to fifty-one point six percent.(时态、主谓、搭配全错)。修正:The figure rose sharply and reached 51.6% in 2019.
常见问题
围绕本题的写作题目与要求、作文类型、配图说明、立意要点、参考范文、谋篇分段与评分丢分,逐条给出可核对的答案。
- 2021年6月英语六级真题第2套 写作的写作题目是什么?要求写多少字?
- 2021年6月英语六级真题第2套 写作(Part I)的写作要求为:For this part, you are allowed 30 minutes to write an essay based on the chart below. You should start your essay with a brief description of the chart and comment on China's achievements in higher education . You should write at least 150 words but no more than 200 words. 本题要求150–200 词。
- 2021年6月英语六级真题第2套 写作属于哪种类型的作文、有什么格式要求?
- 2021年6月英语六级真题第2套 写作 是考研大作文(图表描述 / 漫画评论,先读图再评论)。写作要求150–200 词。题目配有一幅图表,动笔前需先读懂图表意再展开。
- 2021年6月英语六级真题第2套 写作的图表画的是什么、说明了什么?
- 2021年6月英语六级真题第2套 写作的图表内容为:图表标题为“Gross enrolment ratio in higher education in China (1990 - 2019)”,图表横轴代表年份,从1990年到2019年,纵轴代表高等教育毛入学率,范围从0.0%到60.0%。数据来源于教育部,从1990年到2019年每年的数据: 1990年: 3.4% 1995年: 6.86% 2000年: 11% 2001年: 13.3% 2002年: 15% 2003年: 17% 2004年: 19% 2005年: 21% 2006年: 22% 2007年: 23% 2008年: 23.3% 2009年: 24.2% 2010年: 26% 2011年: 26.5% 2012年: 30% 2013年: 34.5% 2014年: 37.5% 2015年: 40.0% 2016年: 42.7% 2017年: 45.7% 2018年: 48.1% 2019年: 51.6% 就本题而言,配图是一张折线图 Gross enrolment ratio in higher education in China (1990 - 2019),横轴是年份、纵轴是毛入学率。最该抓的是整体飙升的大趋势:从 1990年: 3.4% 一路爬到 2019年: 51.6%,中间可挑 2000年: 11%、2012年: 30% 这两个节点当证据,而不是把每一年的数字都罗列出来。
- 2021年6月英语六级真题第2套 写作(先描述图表,再评价高教成就)应该怎么立意、写哪几个要点?
- 2021年6月英语六级真题第2套 写作的中心立意是中心一句话:中国高等教育毛入学率近三十年持续飙升,这组数字正是 achievements in higher education 的缩影。全篇既要描述这条上升曲线,也要把它读成成就的证据。可展开的要点:客观转述数据走向:从 1990年: 3.4% 到 2019年: 51.6% 一路攀升,翻了约十五倍,挑两三个节点佐证即可,不逐年罗列;入学率飙升背后是高校大规模扩招,让普通家庭的孩子也能迈进大学校门——这是 comment on 部分最实在的一个成就;入学率提升意味着更庞大的技能人才库,为经济输送工程师、医生、研究者,从而增强国家竞争力,紧扣 achievements in higher education。
- 2021年6月英语六级真题第2套 写作(先描述图表,再评价高教成就)的参考范文是怎样的?多少词?
- 2021年6月英语六级真题第2套 写作的参考范文(174 词):The line chart illustrates the changes in the gross enrolment ratio in higher education in China from 1990 to 2019. As is clearly shown, the figure witnessed a steady and remarkable upward trend over these three decades. In 1990, only 3.4% of the eligible population entered higher education. This proportion climbed steadily, passing 11% in 2000 and 30% in 2012, before finally reaching 51.6% in 2019, roughly fifteen times the initial level. Behind these figures lie China's impressive achievements in higher education. First, the dramatic rise reflects the massive expansion of university enrolment, which has opened the door of college to millions of ordinary families. Moreover, the higher enrolment ratio means a far larger pool of skilled talent, supplying the economy with engineers, doctors and researchers. In my view, such progress not only improves individual prospects but also strengthens the nation's competitiveness. In conclusion, the steady climb of the enrolment ratio speaks volumes about how far Chinese higher education has advanced, and I firmly believe this positive momentum will continue in the years ahead.
- 2021年6月英语六级真题第2套 写作(先描述图表,再评价高教成就)这篇作文怎么分段、每段写什么?
- 2021年6月英语六级真题第2套 写作的参考范文共 3 段:第 1 段(简要描述图表趋势)落实 start your essay with a brief description of the chart:一两句先点明图表主题与整体上升趋势,再用起点、终点和一两个节点数据佐证;第 2 段(评论高教成就)用一句概括句过渡到 comment on 部分,从扩招惠及大众、壮大人才库两方面分析 achievements in higher education;第 3 段(收束呼应主题)重申上升趋势的意义、表达展望,收尾并把全文控制在 at least 150 words but no more than 200 words 的区间内。
- 2021年6月英语六级真题第2套 写作(先描述图表,再评价高教成就)作文容易在哪丢分?
- 按内容切题 / 结构连贯 / 语言准确 / 字数格式四维评分,本题达标要点:内容切题——本题两个采分动作缺一不可: start your essay with a brief description of the chart 与 comment on 中国的 achievements in higher education。最易失分处就是只写了其中一个;结构连贯——本题最考验衔接的地方是从数据描述转到评论,务必用一句概括句(如 Behind these figures lie...)承上启下,别让"评论"突兀地砸出来;语言准确——本题密集出现趋势描述,rise to / climb from...to / reach + 数字这类搭配要用准;避免 the number rise(主谓不一致)、up to 与 reach 混用这类硬伤;字数格式——本题硬性要求 at least 150 words but no more than 200 words,写太短或超过上限都会扣分;用节点数据而非逐年罗列,正好帮你把篇幅控制在区间内。 典型低分写法(须避免):反面示例:全篇只写 The ratio was 3.4% in 1990, 11% in 2000, 30% in 2012, and 51.6% in 2019.(从头念到尾,只有数字没有一句评价)。修正:在描述之后另起一段评论,如 These rising figures reflect the remarkable achievements China has made in higher education, especially the expansion of university enrolment;反面示例:In 1990 it was 3.4%, in 1995 it was 6.86%, in 2000 it was 11%, in 2001 it was 13.3%...(把二十多个数据全念一遍)。修正:The figure climbed steadily from 3.4% in 1990 to 51.6% in 2019, roughly fifteen times the initial level;反面示例:Education is very important. Our country is becoming stronger and better every day.(正确的废话,与图表毫无关联)。修正:The jump from 3.4% to 51.6% shows how greatly higher education has expanded, giving far more young people access to college;反面示例:The number rise very high and go up to fifty-one point six percent.(时态、主谓、搭配全错)。修正:The figure rose sharply and reached 51.6% in 2019。